auditing file access with samba and splunk
2013-05-08
Preamble
The other week, we had an issue with our working production data on our ZFS file servers. We have a running service that uses a CIFS share to extract file contents, read in a XML file, and then from that file, build out a directory structure based on a field in that order file.
I won’t get into the horrible details, but we eventually discovered that this service does not halt or error an order if that field is missing! What it decided to do instead, was operate at the top level of the CIFS share and “clean up” the directory.
There were a few hard lessons learned here. First off, I didn’t enable snapshots, nor did I have any useful Samba processes auditing (besides the stock log leve, which just shows connects and disconnects). Secondly, we found out that the software we use does not validate inputs very well, and can cause some serious destruction. Imagine getting a call late and night and someone says “Yeah, so that directory that holds workding data is gone.”
After the dust settled and we re-created the working data there were two questions:
- Where is the data
- Do we have a log of who deletes what?
Before this mis-adventure, the only way I was aware of tracking smbd was with additional logging. If you’ve ever looked at high log levels in Samba, you may realize how scary and almost useless it is to turn up debugging.
Fortunately, in the wee hours of the night (this issue lasted until 2am), I ran across how I could enable the full_audit vfs module in Samba. Samba >3.5 allows you to “stack” vfs objects, so I was still able to keep zfsacl and add on full_audit.
Samba Configuration
Samba is pretty dynamic when it comes to new configuration file changes. Unless you are changing the log level you do not have to restart the samba service(s). This allowed me to dynamically add the new full_audit vfs object:
 vfs objects = zfsacl full_audit

 # ZFS ACLS
 nfs4:mode = special
 nfs4:acedup = merge
 nfs4:chown = yes

 # File Auditing
 full_audit:prefix = %u|%I|%m|%S
 full_audit:success = mkdir rename unlink rmdir write
 full_audit:failure = all
 full_audit:facility = local7
 full_audit:priority = NOTICE
This additional configuration is one on a per share basis. The nfs4 parameters are for proper ACL integration with ZFS and Windows (nfs4 style ACLs, which differs from Posix ACLs), and the new full_adit parameters are for logging file changes.
As you can see, we are keeping track of successful directory creations (mkdir), file renaming (rename), deletions (unlink), directory deletions (rmdir) and writes (write… duh). Also, all failures are logged (good for security).
Samba will send these over the syslog local7 facility with a priority of NOTICE. I noticed this change immediately.
Syslog
Syslog will probably stuff these in your default /var/log/messages, but here I first wanted to log it to a separate file, so I added this to syslog.conf:
local7.* /var/log/smbd_audit.logLater, I changed it to just forward it to our central log server so Splunk can index it:
*.* @splunk.bayphoto.comThe file servers we have are using relatively small flash based drive, so I’m not even bothering to write very much locally, so everything gets forwarded to our syslog/splunk server. Since we use ZFS, I just compress the log directories with zfs set compression=gzip6 zroot/logs and hardly worry about space (after a year and a half, we get a compression ration of 18.0 to 1 and haven’t used a full % of the filesystem).
Here is what a sample looks like:
2013-05-09T13:18:50-07:00 zfs-1 smbd_audit: DOMAIN\process_acct|192.168.22.23|192.168.22.23|ROES_ORDERS|unlink|ok|1234567/0205 NY NY-096.jpg
2013-05-09T13:18:50-07:00 zfs-1 smbd_audit: DOMAIN\process_acct|192.168.22.23|192.168.22.23|ROES_ORDERS|rename|ok|1234567/0205 NY NY-096.jpg_Tmp|1234567/0205 NY NY-096.jpg
2013-05-09T13:18:53-07:00 zfs-1 smbd_audit: DOMAIN\process_acct|192.168.22.23|192.168.22.23|ROES_ORDERS|unlink|ok|1234567/TifFre0265-097.jpg
2013-05-09T13:18:53-07:00 zfs-1 smbd_audit: DOMAIN\process_acct|192.168.22.23|192.168.22.23|ROES_ORDERS|rename|ok|1234567/TifFre0265-097.jpg_Tmp|1234567/TifFre0265-097.jpg
2013-05-09T13:18:58-07:00 zfs-1 smbd_audit: DOMAIN\process_acct|192.168.22.23|192.168.22.23|ROES_ORDERS|unlink|ok|1234567/TifFre0261-098.jpg
2013-05-09T13:18:58-07:00 zfs-1 smbd_audit: DOMAIN\process_acct|192.168.22.23|192.168.22.23|ROES_ORDERS|rename|ok|1234567/TifFre0261-098.jpg_Tmp|1234567/TifFre0261-098.jpg
2013-05-09T13:19:01-07:00 zfs-1 smbd_audit: DOMAIN\process_acct|192.168.22.23|192.168.22.23|ROES_ORDERS|unlink|ok|1234567/TifFre0264-099.jpg
2013-05-09T13:19:01-07:00 zfs-1 smbd_audit: DOMAIN\process_acct|192.168.22.23|192.168.22.23|ROES_ORDERS|rename|ok|1234567/TifFre0264-099.jpg_Tmp|1234567/TifFre0264-099.jpg
2013-05-09T13:19:04-07:00 zfs-1 smbd_audit: DOMAIN\process_acct|192.168.22.23|192.168.22.23|ROES_ORDERS|unlink|ok|1234567/TifFre0267-100.jpg
2013-05-09T13:19:04-07:00 zfs-1 smbd_audit: DOMAIN\process_acct|192.168.22.23|192.168.22.23|ROES_ORDERS|rename|ok|1234567/TifFre0267-100.jpg_Tmp|1234567/TifFre0267-100.jpg
In these 10 lines, we see the proccess_acct user creating and renaming image files. It was probably building thumbnail images based on the source images.
Splunk - event type
Before I could start just building charts, I had to classify these log events, and that was very easy since Samba logs the process as smbd_audit:
in my eventtypes.conf, I have:
[smbd_audit]
search = host="zfs-*" process="smbd_audit"
This simply tags any log event coming from one of our zfs file servers, and with the process smbd_audit, is a new event type called smbd_audit.
I know, my creativity and wittiness is stunning.
From there, I wanted to start extracting some of the fields I found useful to be able to report on:
- smb_host : IP address of the client
- smb_user : User name (Active Directory domain account) performing the action
Splunk - field extraction
Here are the three fields I’ve extracted from the smbd_audit event type. In the future, I’d like to build a full transaction that can show the “work” for a single order.
[eventtype::smbd_audit]
EXTRACT-smb_order_type = (?i)^(?:[^\|]*\|){3}(?P<smb_order_type>[^\|]+)
EXTRACT-smb_user = (?i) smbd_audit: (?P<smb_user>[^\|]+)
EXTRACT-smb_host = (?i)\|(?P<smb_host>[^\|]+)
splunk - report over time
After all of that, I created a simple search over time to show
[smb access by order type]
cron_schedule = 0 * * * *
dispatch.earliest_time = -24h@h
dispatch.latest_time = now
displayview = report_builder_display
enableSched = 1
request.ui_dispatch_view = report_builder_display
search = eventtype="smbd_audit" | timechart span=10m count by smb_order_type
vsid = *:hggviexo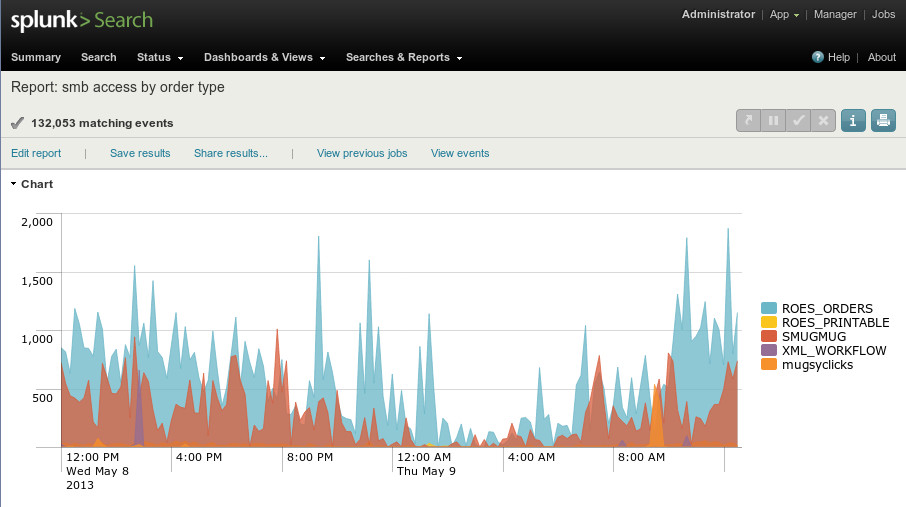
Chart
Final Thoughts
My good buddy Steve has told me that statistical data without an action item is worse than having no data at all. That makes sense.
This is worthless :)
I’m not sure what I really want to do with this information, probably nothing in this iteration. It does give me a view into our file servers, and how much work is performed per share (which correlates to an order type)
I might create a dashboard to summarize our Samba servers, but at the end of the day, its nice to be able to search of a file getting deleted.